cond_boxplot() conditions all variables on x by quantile binning and
shows the boxplots for the other variables for each value of qbinned x.
cond_boxplot(
  data,
  x = NULL,
  n = 100,
  min_bin_size = NULL,
  color = "#002f2f",
  fill = "#2f4f4f",
  auto_fill = FALSE,
  ncols = NULL,
  xmarker = NULL,
  qmarker = NULL,
  show_bins = FALSE,
  xlim = NULL,
  connect = FALSE,
  ...
)
Arguments
- data
a
data.frameto be binned- x
charactervariable name used for the quantile binning- n
integernumber of quantile bins.- min_bin_size
integerminimum number of rows/data points that should be in a quantile bin. If NULL it is initiallysqrt(nrow(data))- color
The color to use for the line charts
- fill
The fill color to use for the areas
- auto_fill
If
TRUE, use a different color for each category- ncols
The number of column to be used in the layout
- xmarker
numeric, the x marker.- qmarker
numeric, the quantile marker to use that is translated in a x value.- show_bins
if
TRUEa rug is added to the plot- xlim
numeric, the limits of the x-axis.- connect
if
TRUEsubsequent medians are connected.- ...
Additional arguments to pass to the plot functions
Value
A list of ggplot objects.
Details
cond_boxplot is the same function as funq_plot() but with different defaults,
namely connect = FALSE and auto_fill = FALSE.
funq_plot highlights the functional relationship between
x and the y-variables, by connecting the medians of the quantile bins.
qbin_boxplot() shows the boxplots of the quantile bins on a quantile scale.
See also
Other conditional quantile plotting functions:
cond_barplot(),
cond_heatmap(),
funq_plot()
Examples
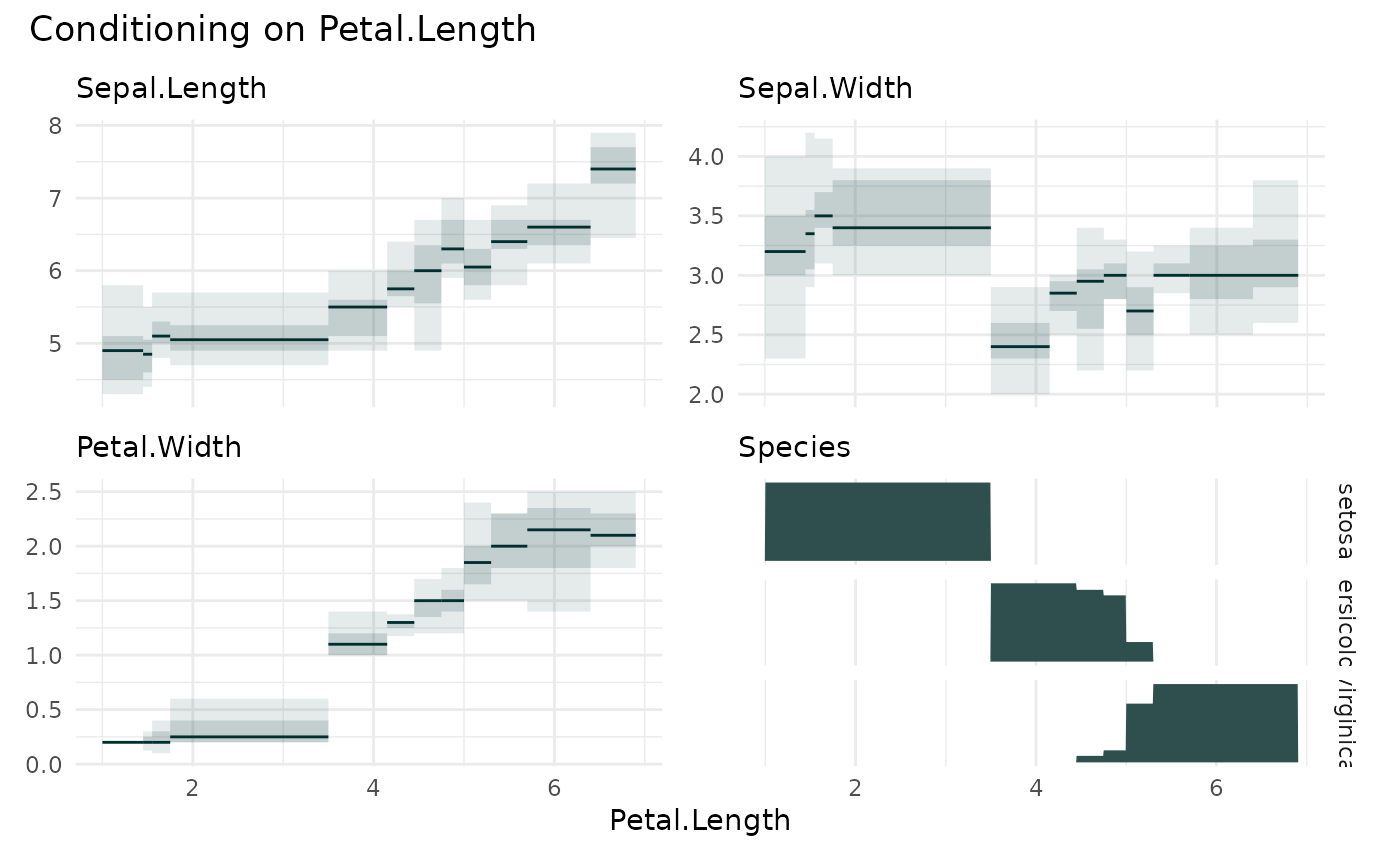
cond_boxplot(
  iris, x = "Petal.Length"
)
#> `overlap` not specified, using `overlap=FALSE`
#> `min_bin_size`=12, using `n=12`