funq_plot() conditions on variable x with quantile binning and
plots the median and interquartile range of numerical variables and level frequency
of the other variables as a function the x variable.
funq_plot(
  data,
  x = NULL,
  n = 100,
  min_bin_size = NULL,
  overlap = NULL,
  color = "#002f2f",
  fill = "#2f4f4f",
  auto_fill = TRUE,
  ncols = NULL,
  xmarker = NULL,
  qmarker = NULL,
  show_bins = FALSE,
  xlim = NULL,
  connect = TRUE,
  ...
)
Arguments
- data
a
data.frameto be binned- x
charactervariable name used for the quantile binning- n
integernumber of quantile bins.- min_bin_size
integerminimum number of rows/data points that should be in a quantile bin. If NULL it is initiallysqrt(nrow(data))- overlap
logicalifTRUEthe quantile bins will overlap. Default value will beFALSE.- color
The color to use for the line charts
- fill
The fill color to use for the areas
- auto_fill
If
TRUE, use a different color for each category- ncols
The number of column to be used in the layout
- xmarker
numeric, the x marker.- qmarker
numeric, the quantile marker to use that is translated in a x value.- show_bins
if
TRUEa rug is added to the plot- xlim
numeric, the limits of the x-axis.- connect
if
TRUEsubsequent medians are connected.- ...
Additional arguments to pass to the plot functions
Value
A ggplot object with the plots
Details
By highlighting and connecting the median values it creates a functional view of the data.
What is the (expected) median given a certain value of x?
It qbins the x variable and plots the medians of the qbins vs the other variables, thereby
creating a functional view of x to the rest of the data,
calculating the statistics for each bin, hence the name funq_plot.
See also
Other conditional quantile plotting functions:
cond_barplot(),
cond_boxplot(),
cond_heatmap()
Examples
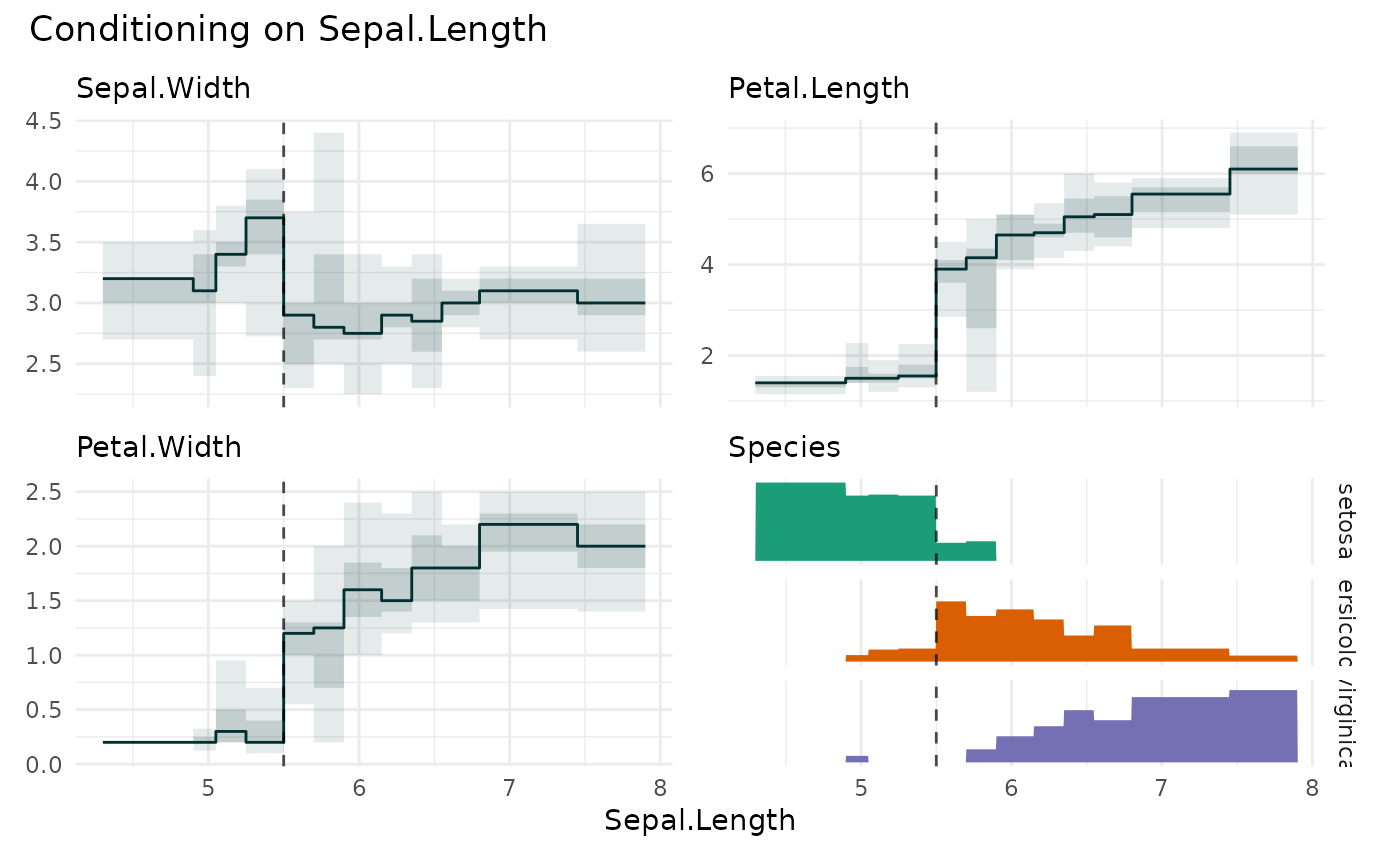
funq_plot(iris, "Sepal.Length", xmarker=5.5)
#> `overlap` not specified, using `overlap=FALSE`
#> `min_bin_size`=12, using `n=12`
 # \donttest{
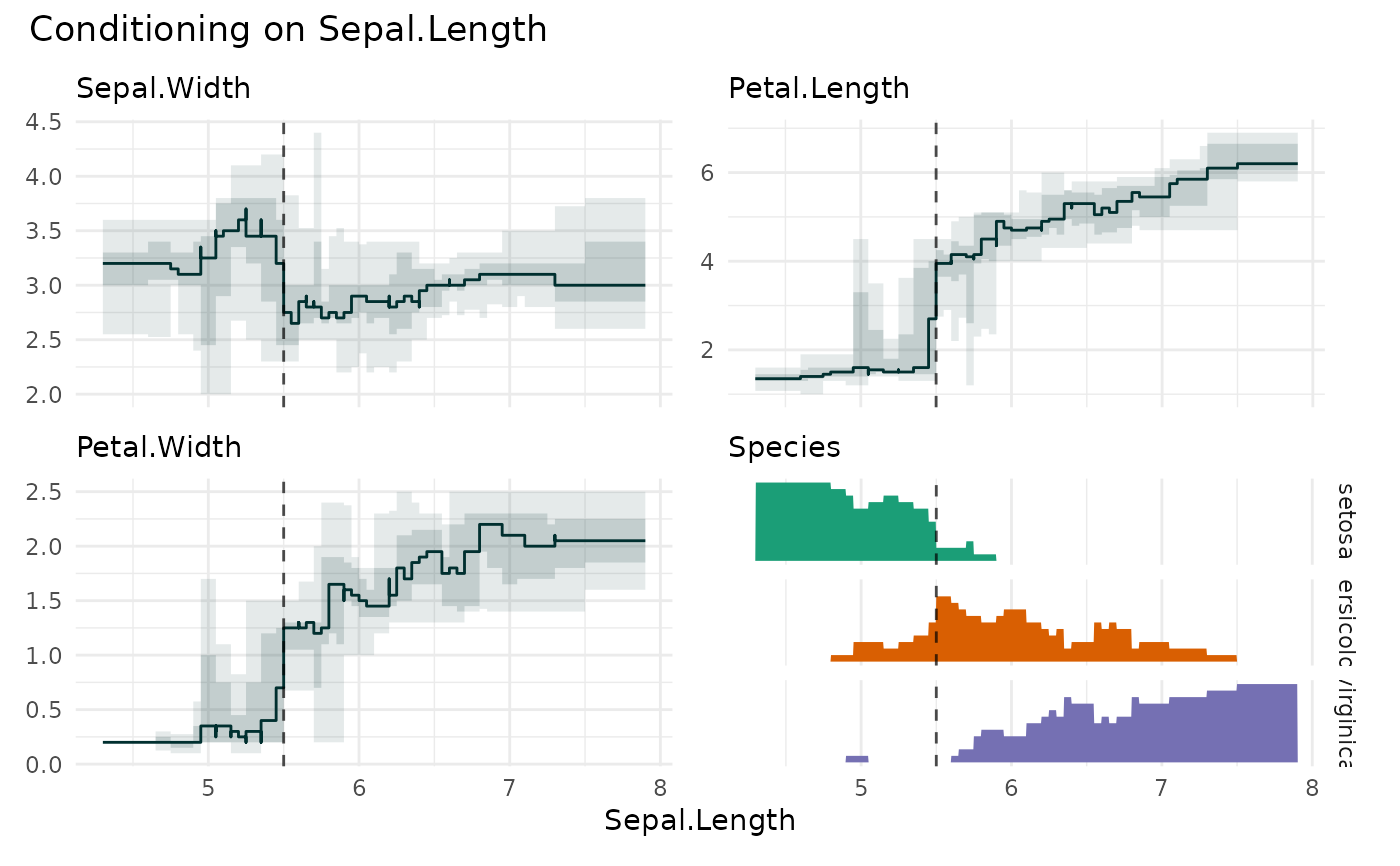
funq_plot(
iris,
x = "Sepal.Length",
xmarker=5.5,
overlap = TRUE
)
# \donttest{
funq_plot(
iris,
x = "Sepal.Length",
xmarker=5.5,
overlap = TRUE
)
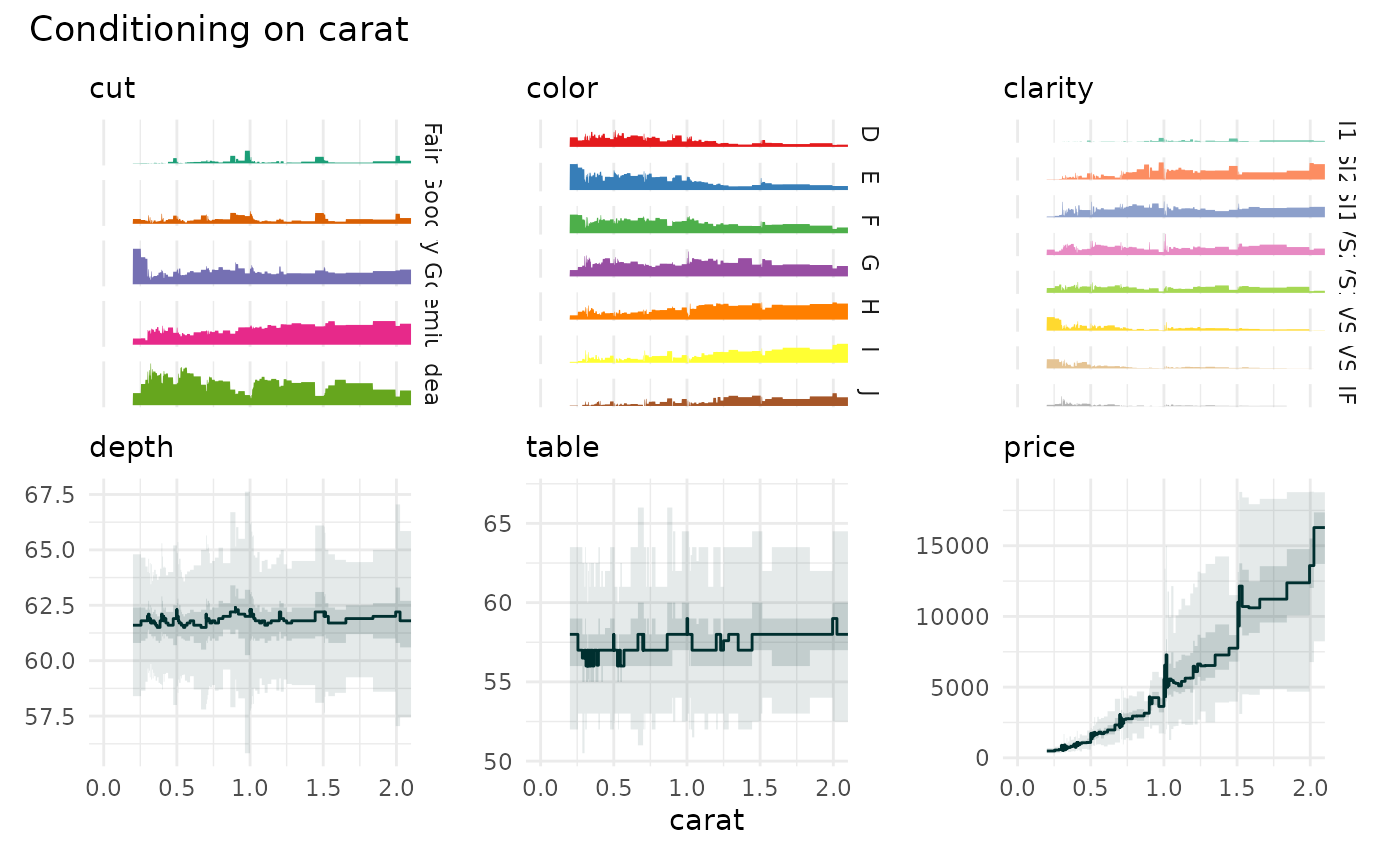
 data("diamonds", package="ggplot2")
funq_plot(diamonds[c(1:4,7)], "carat", xlim=c(0,2))
data("diamonds", package="ggplot2")
funq_plot(diamonds[c(1:4,7)], "carat", xlim=c(0,2))
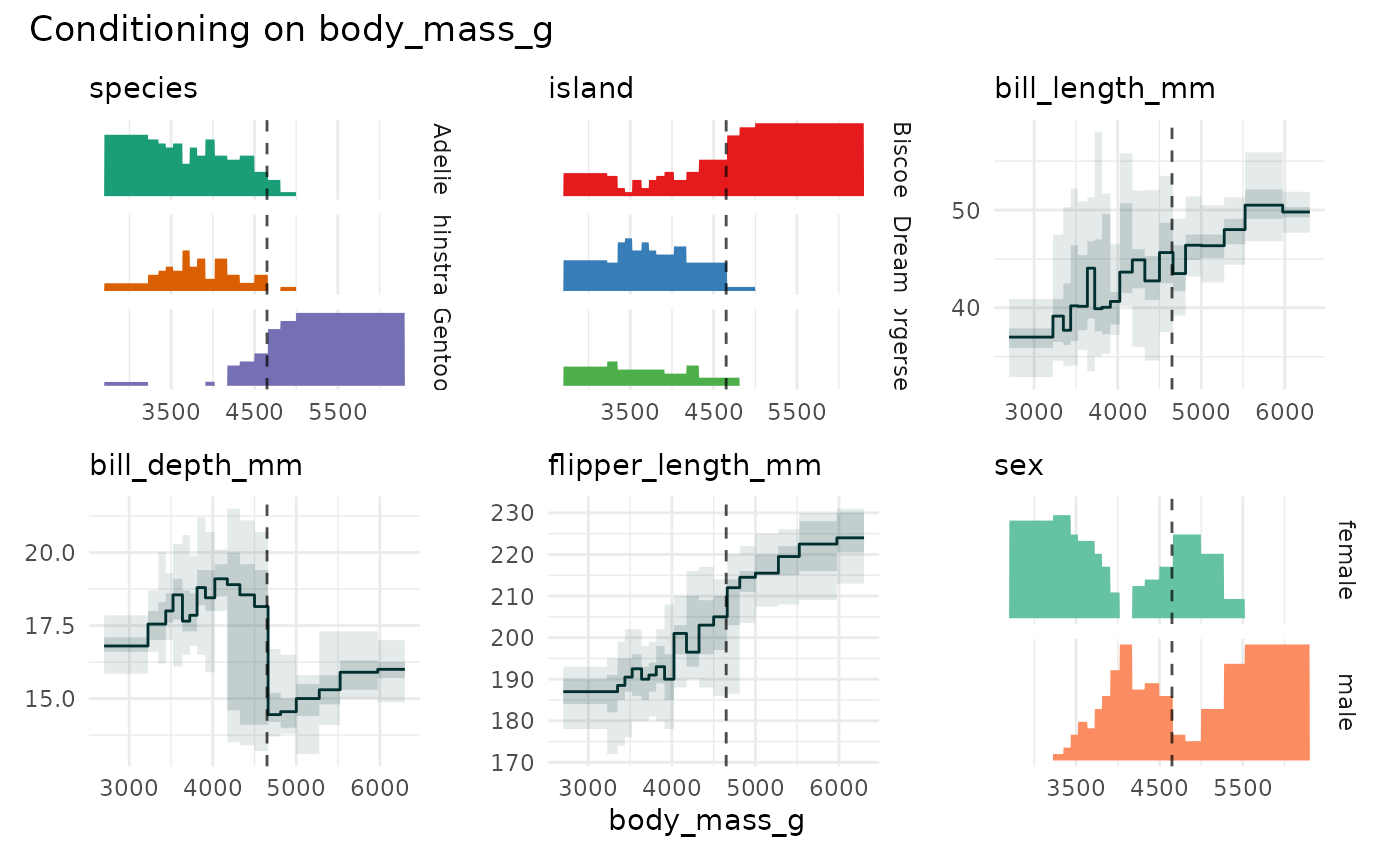
 if (require(palmerpenguins)){
funq_plot(
penguins[1:7],
x = "body_mass_g",
xmarker=4650,
ncol = 3
)
}
#> `overlap` not specified, using `overlap=FALSE`
#> `min_bin_size`=18, using `n=19`
if (require(palmerpenguins)){
funq_plot(
penguins[1:7],
x = "body_mass_g",
xmarker=4650,
ncol = 3
)
}
#> `overlap` not specified, using `overlap=FALSE`
#> `min_bin_size`=18, using `n=19`
 # }
# }